How Can We Help?
Search for answers or browse our knowledge base.
Monitoring Sync Status
The status page presents reports on the progress of synchronizations and DevOps gate processes logs.
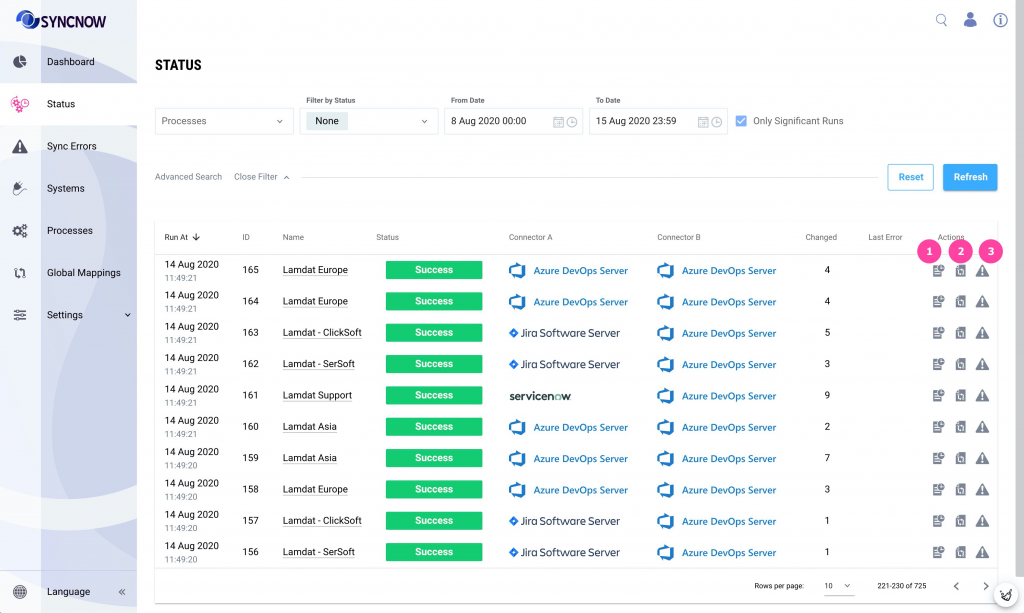
- Each row in the grid is a synchronization of one process
- One process defines a set of entities
- Each sync run for the process contains (Figure 1)
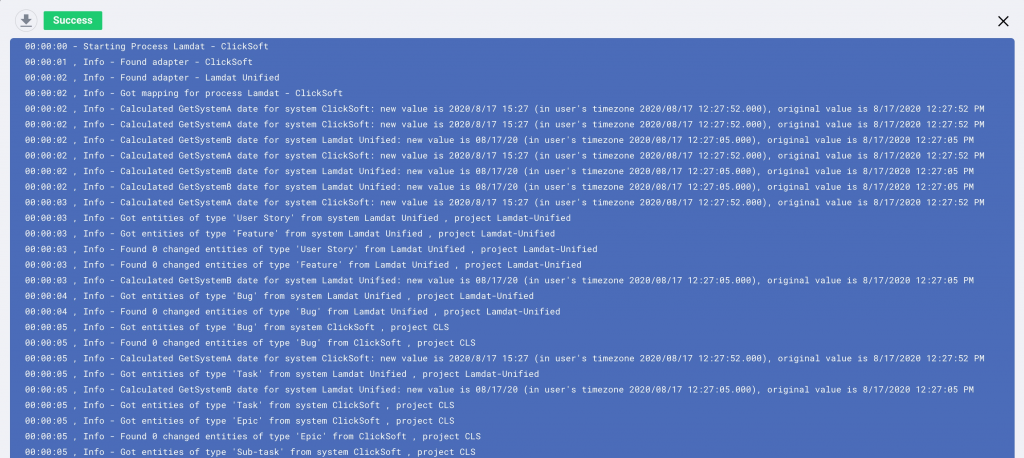
- The Log (Figure 2)
- Status Entities – detailed information about source and target entities (Figure 3)
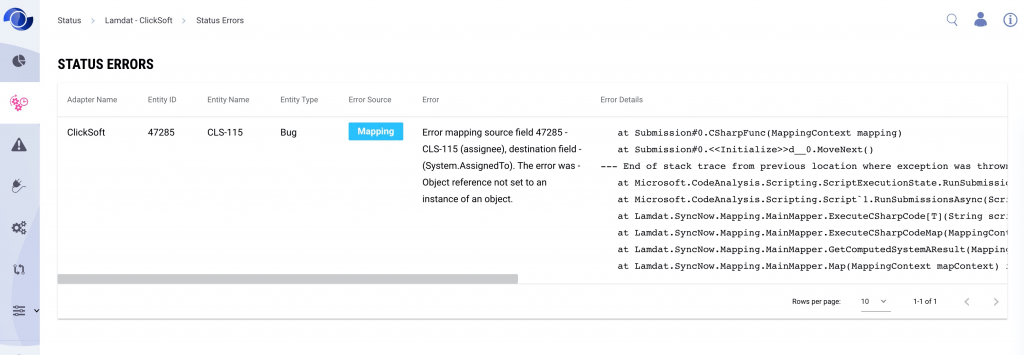
- Status Errors – detailed information about errors that occurred during one sync run (Figure 4)

Figure 1. Detailed information about each sync run.

Figure 2. Details of one sync run execution

Figure 3. Updated entities after one sync run.

Figure 4. Errors that occurred during one sync run
The frequency of synchronisations is configured on System Settings page.
How to read Status grid
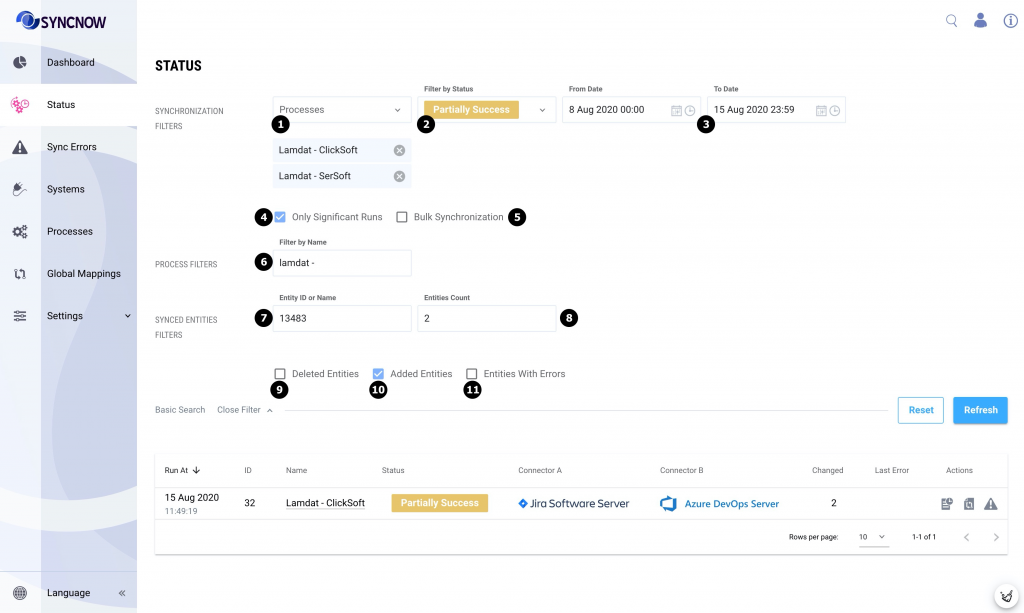
The synchronization history can be filtered by:
- Processes
- Final status of synchronization. Can be Success, Fail, Partially Success
- Date-time period of sync run
- Only significant runs. The significant sync runs can have only one of three statuses:
- Success with at least 1 changed entities;
- Fail
- Partially Success
- Bulk synchronization. The checkbox shows in the grid only sync runs that caused by SyncNow after Bulk Sync From Date or Bulk Sync From CSV.
- Text in a process name
- Synced entity (source or target) ID or text in synced entity name
- Amount of changed entities after sync run
- Deleted entities. The grid will contains only sync runs during which a deleted target entity was detected. Target entity can be deleted in target system
- Added entities. The grid will contains only sync runs during which a new entity was created in target system and in the same time a new entities pair was created in SyncNow DB.
- Sync runs were sync error occurred.

